I never finished my analysis and hence this post. I now decided to publish it anyways, so that if anyone happens to get their Go programs flagged they can stumble upon this and get a better idea why.
TLDR
The current evidence pretty much points towards false positives. There doesn’t seem to be malware in the Go runtime or toolchain. (Though I can’t say for sure, since well… see above)
The issue
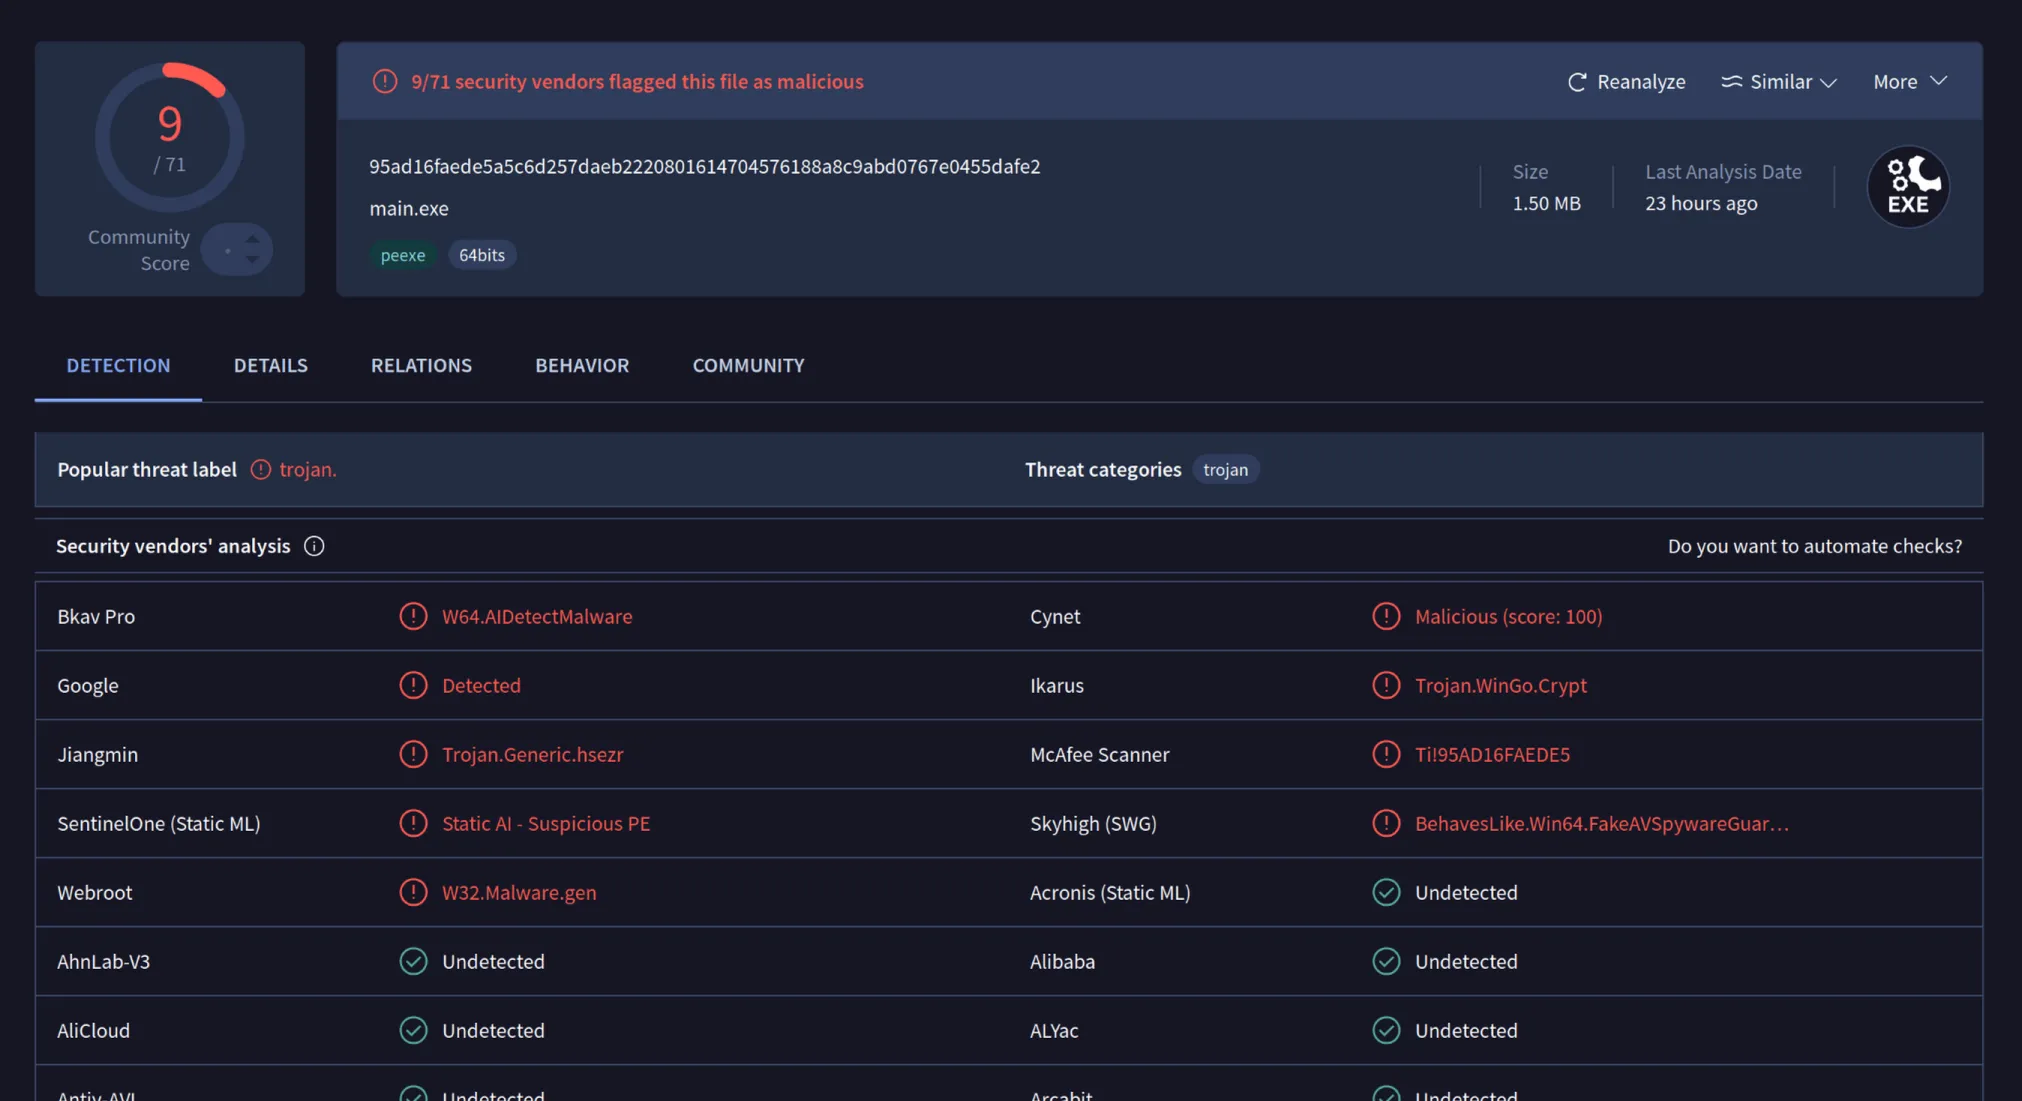
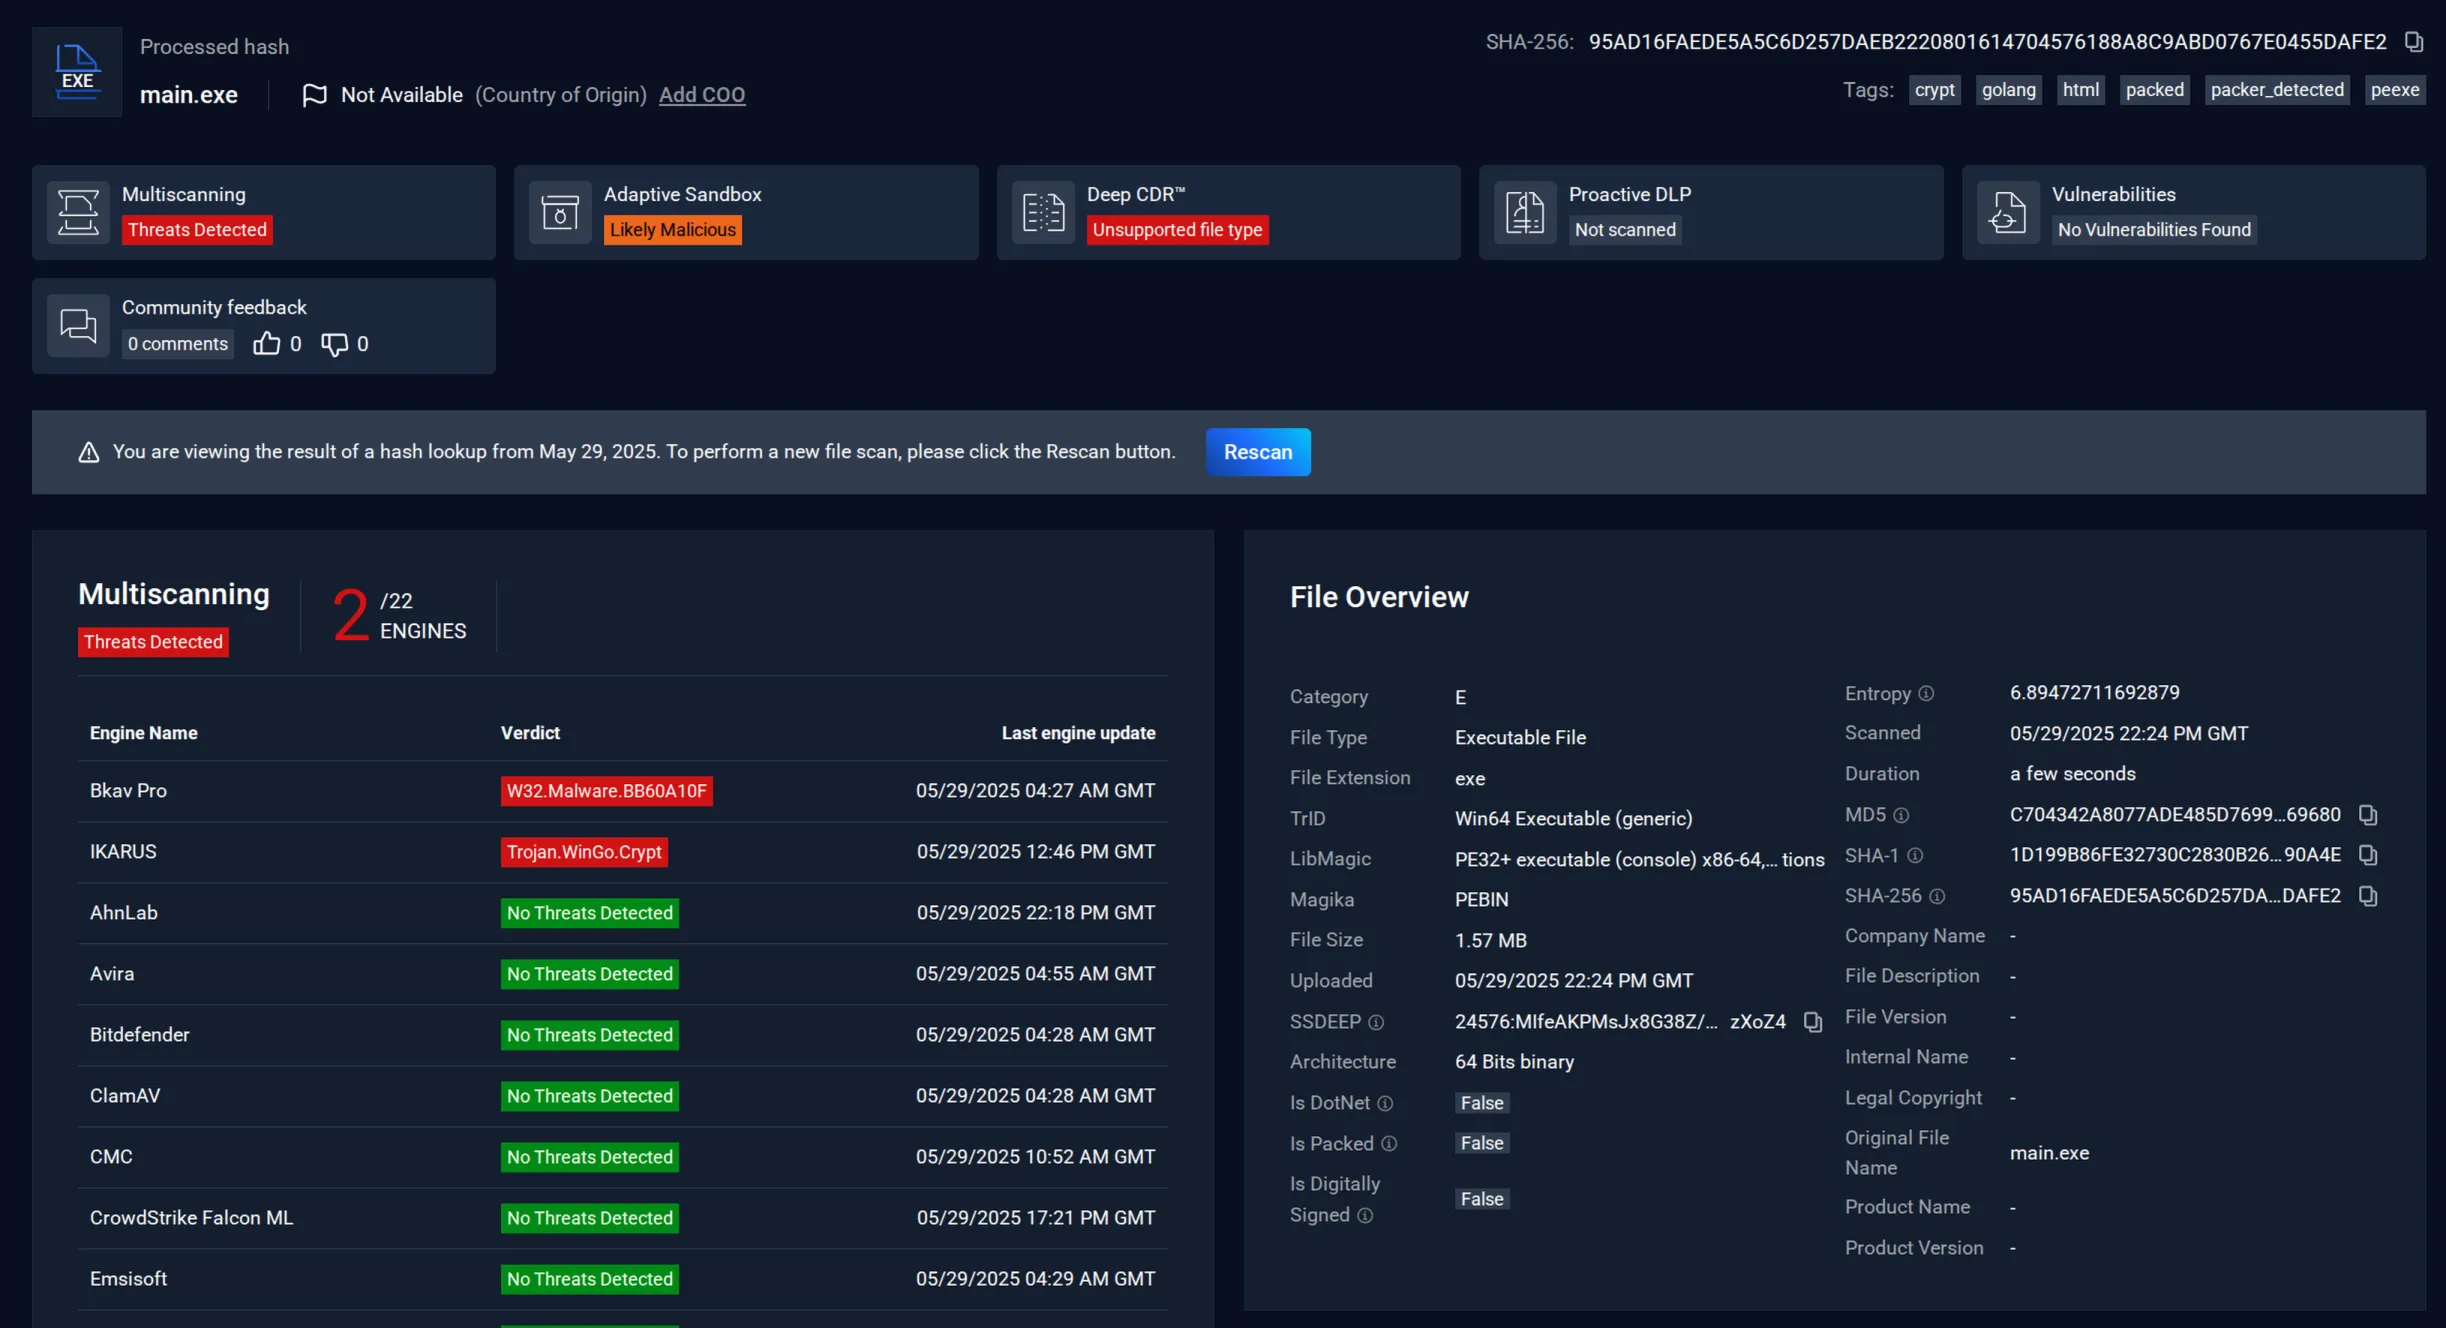
During work on a Go project, a simple Windows Go executable ended up being submitted to the malware scanners VirusTotal and MetaDefender. To our surprise both scanners reported multiple malicious-flags. Suspicious properties like high entropy, containing cryptographic primitives or making network calls were found.
This was weird for multiple reasons:
This behaviour could only be reproduced for Windows executables. Linux executables were not flagged at all.
This behaviour was consistent for any freshly compiled Windows executable indepedent of compilation environment, meaning we could rule out malicious modification of our executable after compilation.
This behaviour is consistent for even the simplest of Go programs. No extra imports required.
The question is now, what causes these flags and behaviour reports? Did we find malware in the Go toolchain?
Reproducing the scans
First off, lets start with reproducing the scans. This is a simple “Hello World” program in Go:
packagemain
funcmain() {
print("hello world!")
}
Environment
We compile our executable using the Go toolchain on a Linux system. Since the Go toolchain contains compiler, assembler and linker we don’t need to check any other dependencies of our system.
Terminal window
$ go version
go version go1.24.3 linux/amd64
$ go tool compile -V
compile version go1.24.3
$ go tool asm -V
asm version go1.24.3
$ go tool link -V
link version go1.24.3
Linux executables
Now, lets start with building a Linux executable and checking if the malware scanners flag our executable:
Terminal window
# Produces a main.elf Linux executable
$gobuild-omain.elfmain.go
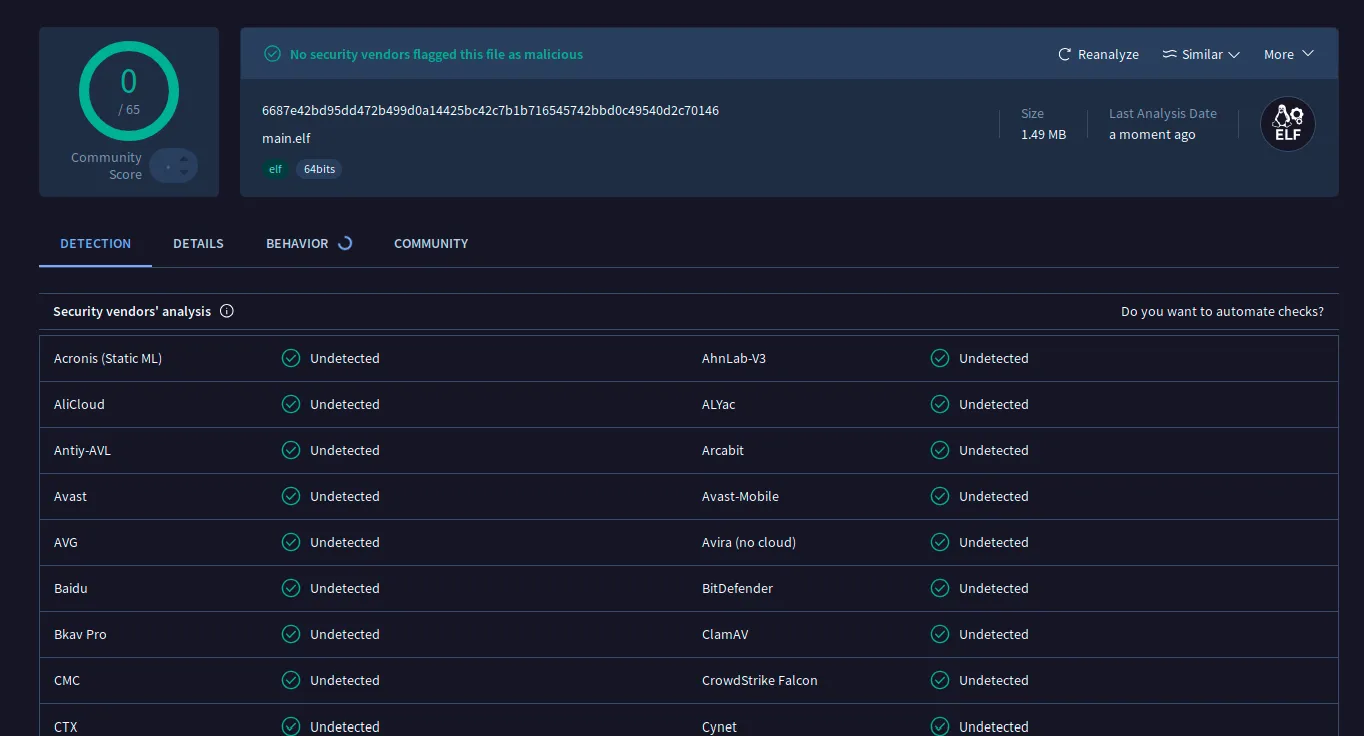
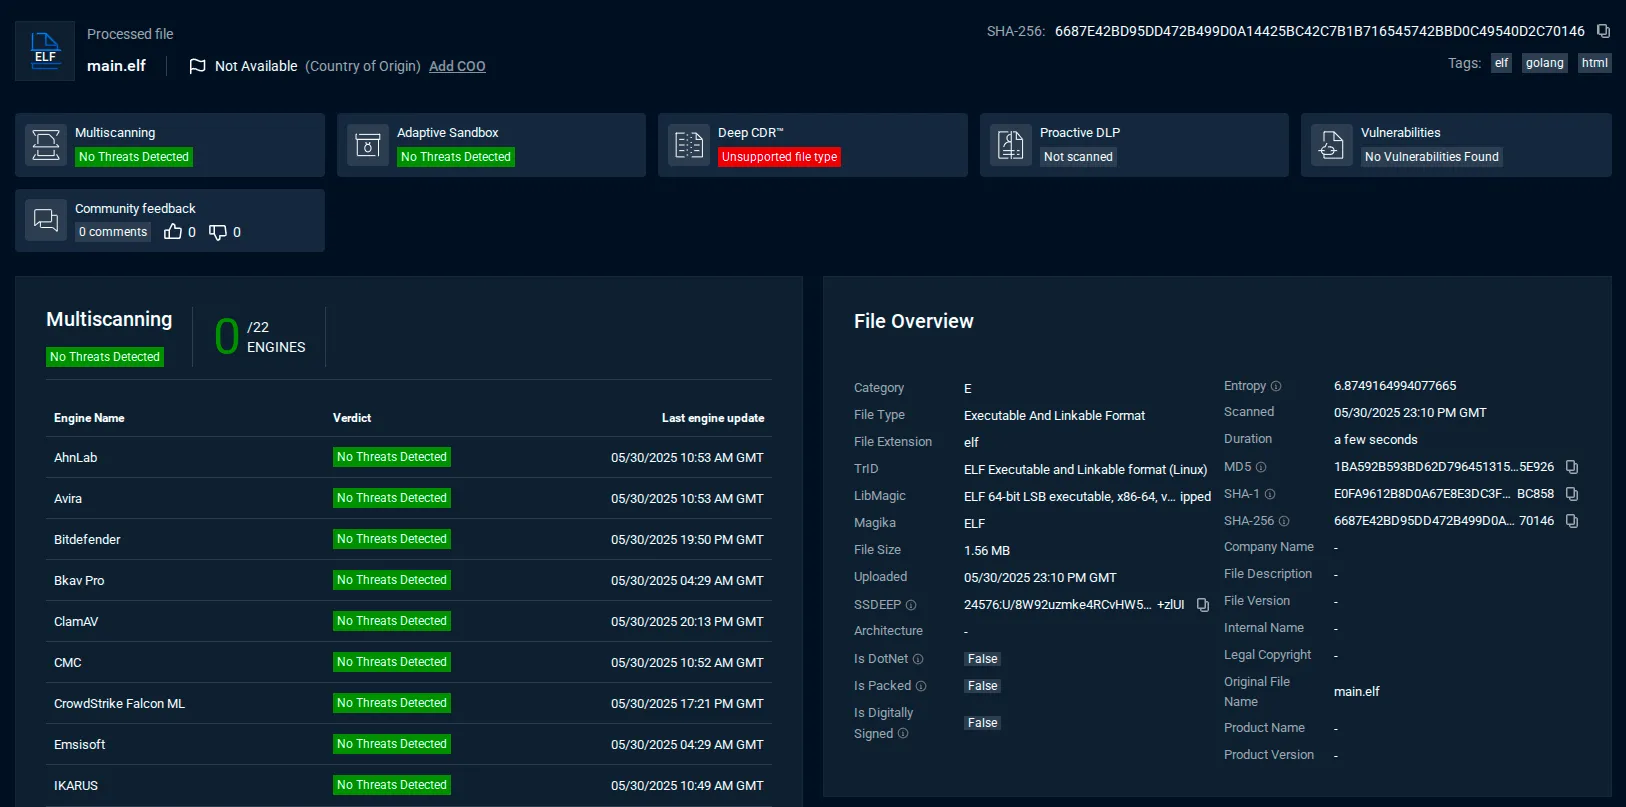
When uploading this binary to both malware scanners neither of them show any malware-flags:
We found the following warnings of the scans especially interesting:
Warning
Screenshot
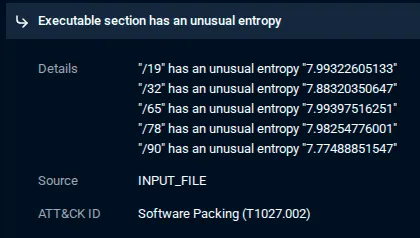
High entropy (Meta Defender) The executable contains sections with high entropy. This usually suggests encryption to make reverse-engineering / understanding it harder.
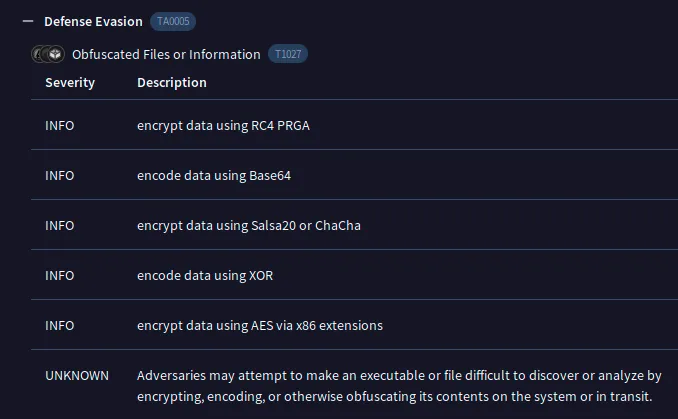
Obfuscated Files or Information (VirusTotal) The executable contains cryptographic-primitives like RC4 or AES. This would again suggest encryption of our binary.
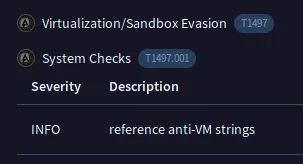
Virtual Machine detection (VirusTotal) The executable seems to contain strings related to the detection of virtual machines. This is usually done to detect the usage of Sandboxes. This way malware doesn’t trigger during analysis.
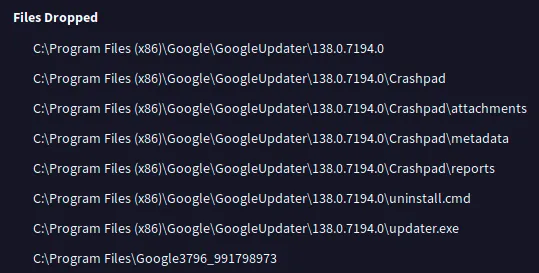
Installation of a Google Updater? (VirusTotal) The executable seems to drop files inside the Google Updater directory. This suggests that malware is installed.
In the following chapters we are going to have a look at these warnings and their cause:
High Entropy
The first warning are high entropy sections in the executable, which often suggests encrypted data. Malicious actors would do this to hide bad code.
Comparing Windows and Linux
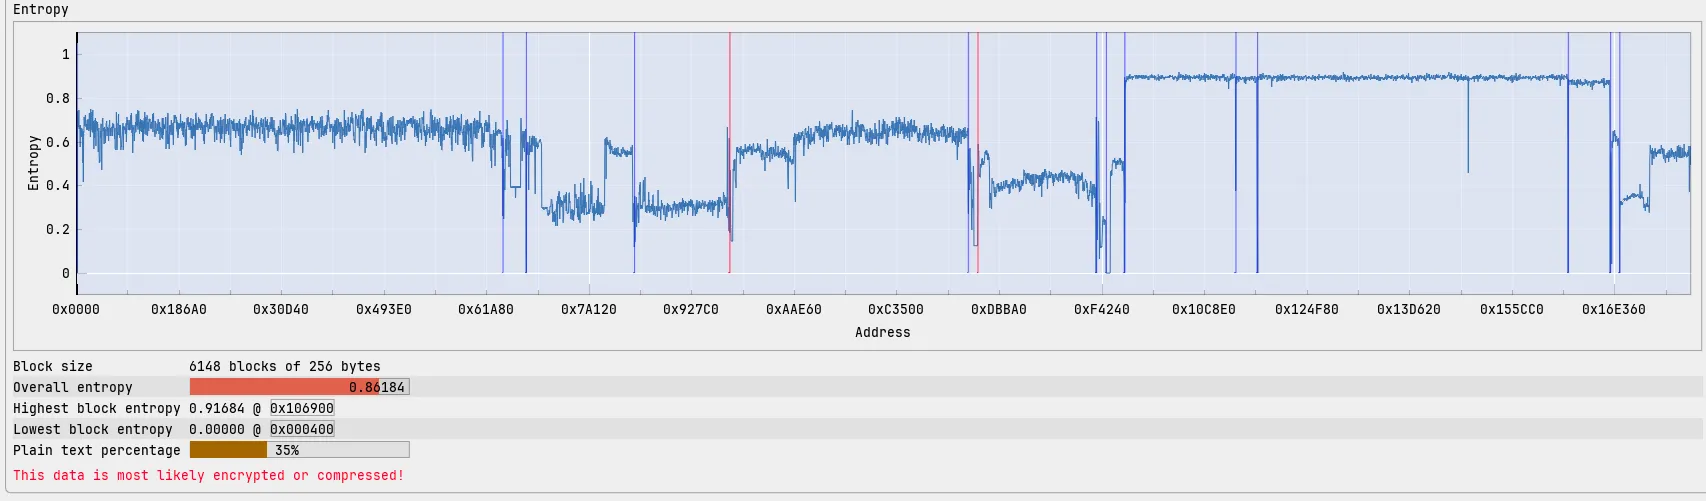
The first thing we can do is simply compare the entropy of our Windows/Linux executables. Maybe our Linux executable doesn’t contain any of these sections since it didn’t raise any flags. To do that we use the ImHex hex editor which provides tools for reverse engineering. The Data Information View for example can visualize the Shannon entropy of our binary.
This graph shows the entropy of our Windows executable:
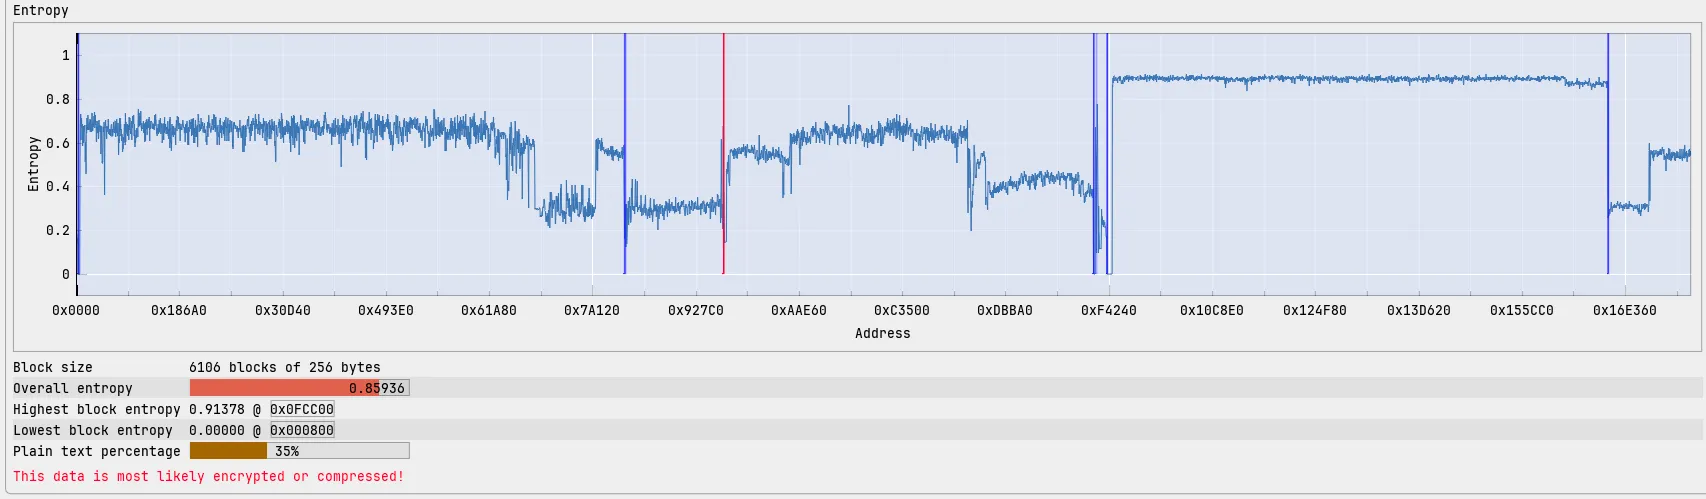
This graph shows the entropy of our Linux executable:
We immediately see that both of our binaries have sections of high entropy distributed in the same manner. So the existence of high entropy sections is not exclusive to the Windows executable. It simply appears to not be deemed dangerous for the Linux executable.
Analysis of high entropy sections
MetaDefender explicitly names the following executable sections for having unusually high entropy:
/19
/32
/65
/78
/90
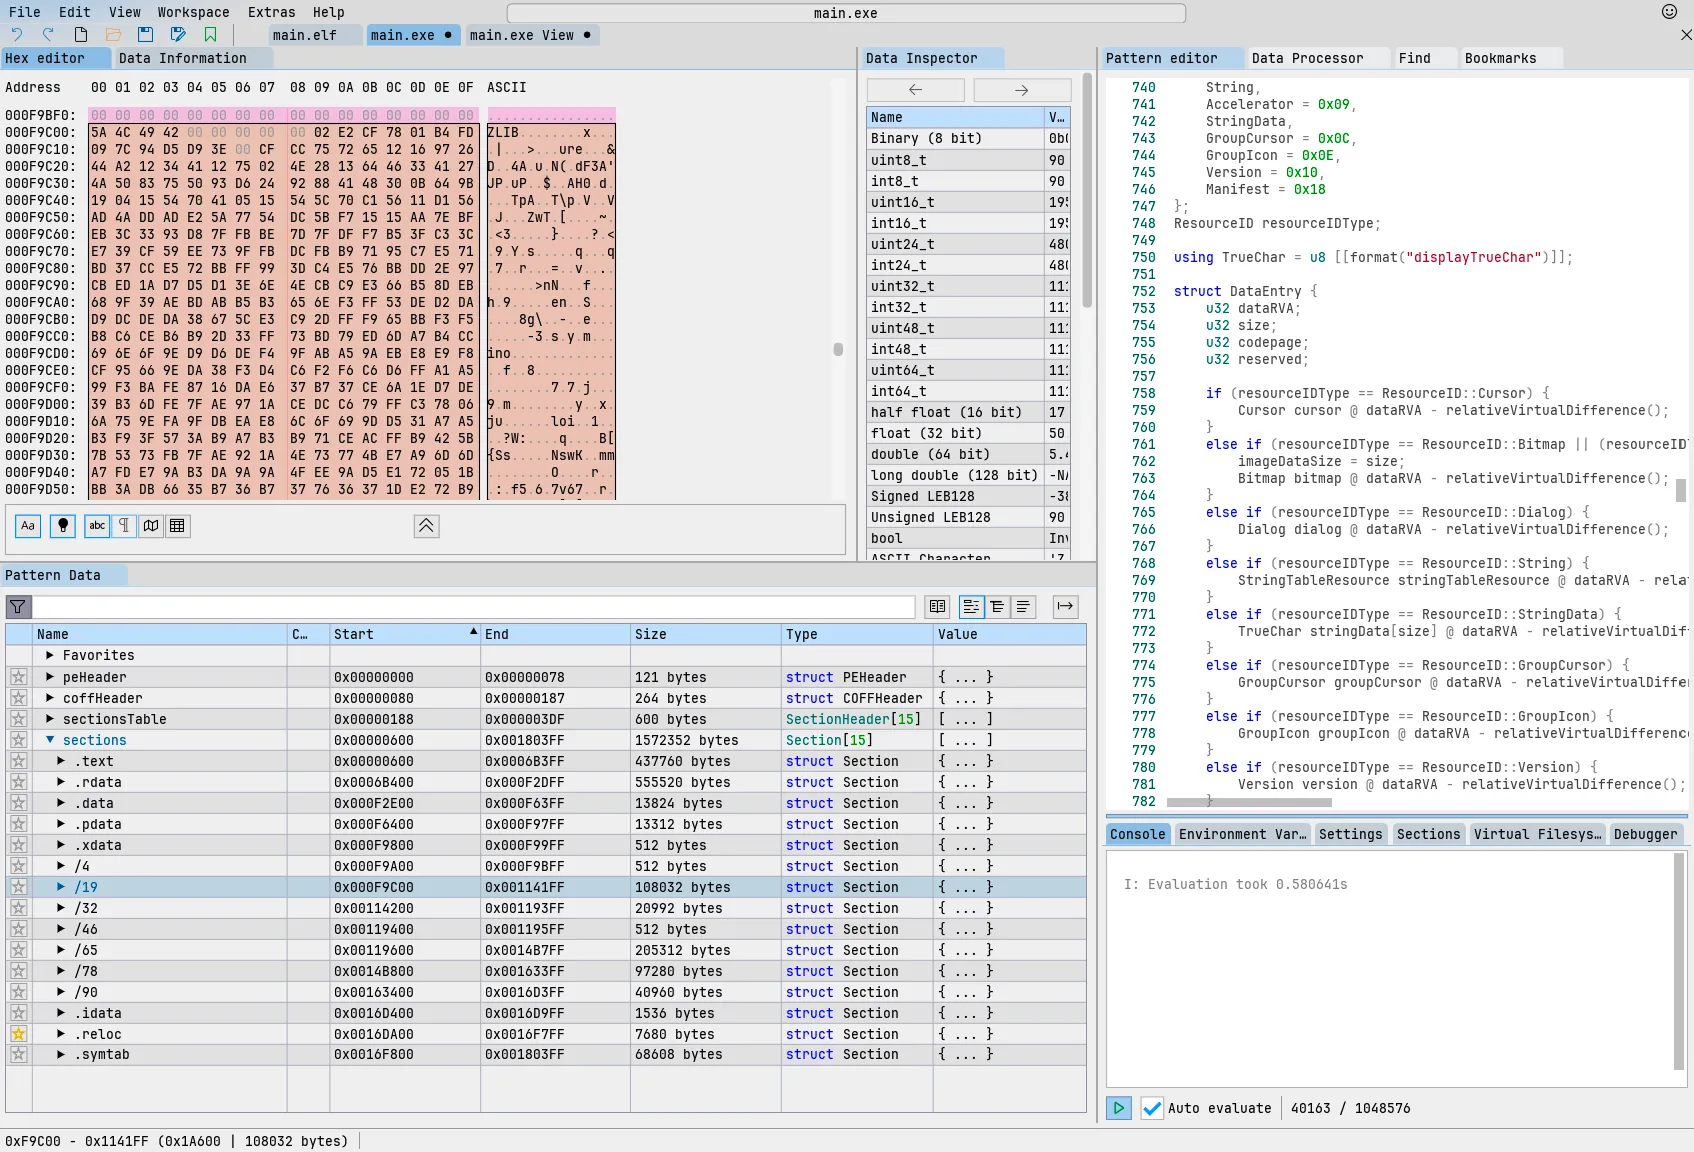
We can use the pattern analysis system of ImHex to find these sections in our binary. To do that we first load the Microsoft PE Portable Executable pattern in the Pattern Editor view and the start the pattern evaluation.
We are now shown information in the Pattern Data view:
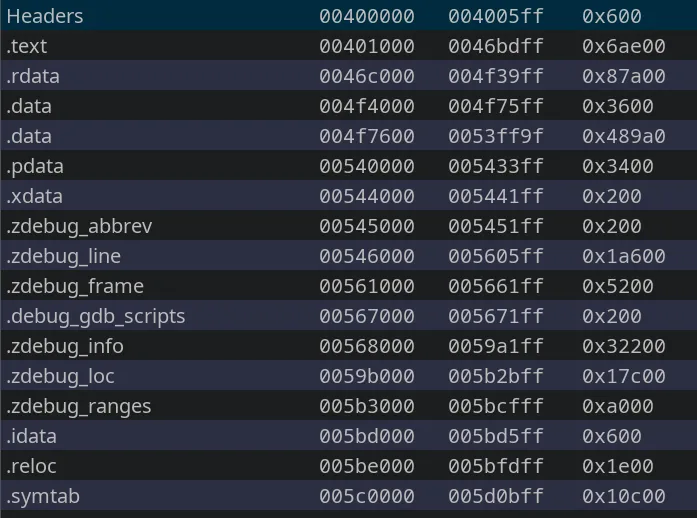
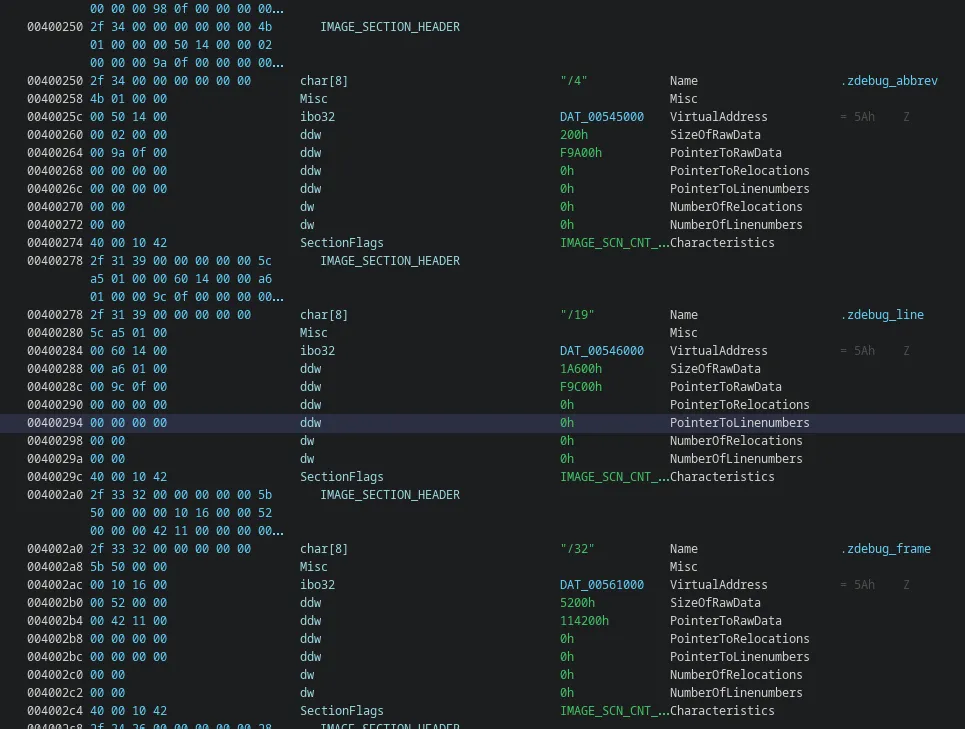
Upon closer inspection we see that all our marked sections /19, /32, /65, /78, /90 start with the ASCII symbols ZLIB. Meaning these sections are probably ZLIB compressed data which would explain the high entropy. Looking past the first 12 Bytes we can see a ZLIB magic header 0x78 0x01 which signifies low or no compression. If we use Ghidra and have a look at these sections in the Memory Map view we see that Ghidra has assigned our sections proper names:
The memory map view. It shows us the executable sections and their respective address ranges.
The image section headers of our Windows executable. We can see the actual and assigned names.
So our sections are actually named the following:
.zdebug_line
.zdebug_frame
.zdebug_info
.zdebug_loc
.zdebug_ranges
After looking them up we find that these section names are part of the DWARF debugging data format, meaning this is debug data for the executable:1
.debug_abbrev
Abbreviations used in the .debug_info section
.debug_line
Line number information
.debug_frame
Call frame information
.debug_info
Core DWARF information section
.debug_loc
Location lists used in the DW_AT_location attributes
.debug_ranges
Address ranges used in the DW_AT_ranges attributes
The “z” prefix suggests that they are compressed using ZLIB.
Disabling debug symbols
Since we now know that the source of our unusually high entropy are debug symbols, we can simply disable them when building:
Terminal window
# Produces a sans_debug.exe Windows executable without debug symbols
Now we can compare our binary’s entropy with debug symbols (main.exe):
And without debug symbols (sans_debug.exe):
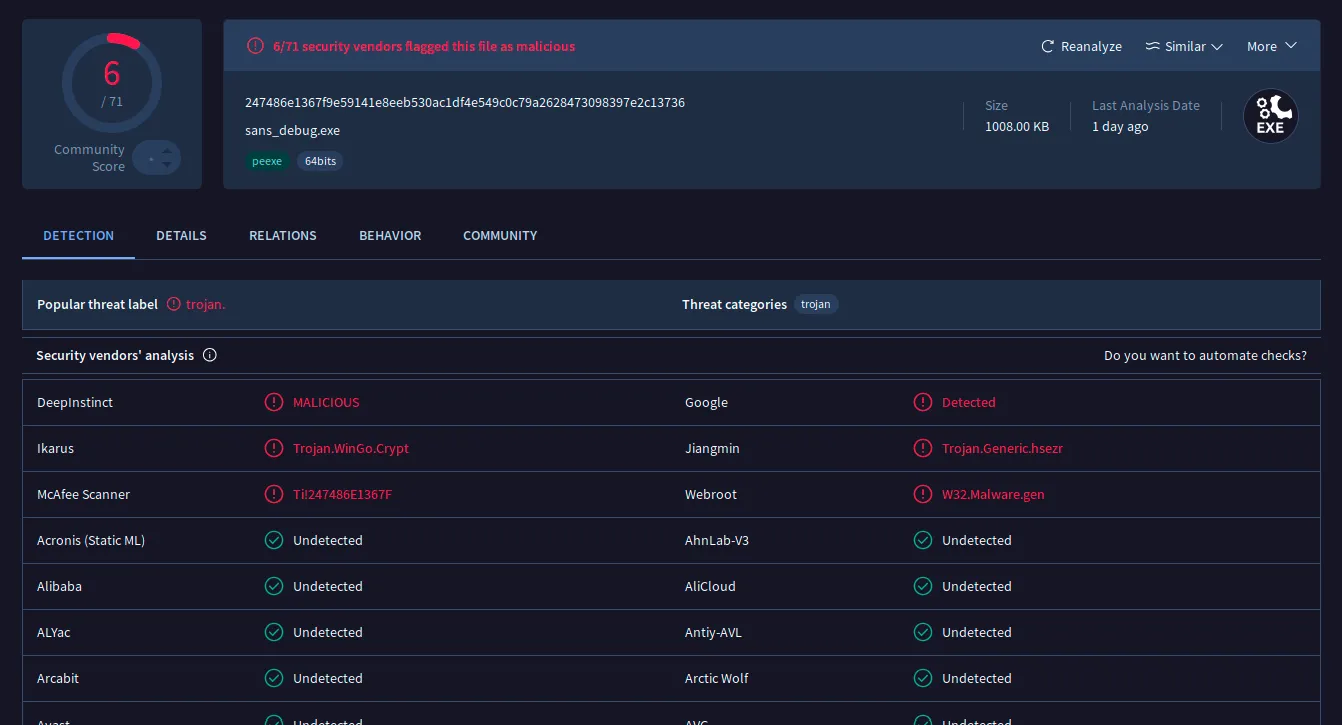
We see that the high entropy block starting around 0xF4... in main.exe is missing in sans_debug.exe. If we upload sans_debug.exe into the malware scanners we see that some of the malicious-flags, have disappeared:
MetaDefender Cloud also no longer complains about suspicious entropy.
IMPORTANT
Addendum: 06/11/2025
I revisited the scan on VirusTotal and the scan-result seems to have changed? There are now 8/72 malicious-flags.
Screenshot from 06/11/2025
We can see in the screenshot that now CrowdStrike Falcon and GData flag our executable as malicious too. I find it worrying that these test-results are seemingly not persistent. In the future I will have to take care to archive any scan-results. The point however still stands. Removing debug symbols decreases malicious flag. The MetaDefender Cloud scan stays unchanged.
What about linux
Alright, so the problem is compressed debug symbols, but…
Why are these only flagged for the Windows executable and not the Linux executable?
One possible explanation is that our sections do not start with a valid ZLIB compression. Since our ZLIB compressed block and its headers are preceded by 12 bytes of data, the scanners probably don’t know what to do with these sections and can’t decompress them.
Another possible explanation is that the scanners are unable to decompress ZLIB at all. The linux executables do not use ZLIB for the debug symbols but deflate. Maybe the scanners can decompress deflate but not ZLIB.
Crypto Primitives
The next warning is the appearance of crypto algorithms in our executable. VirusTotal explicitly lists the following:
RC4 (PRGA)
Base64
Salsa20 or ChaCha
XOR
AES via x86 extensions
Since every Go binary contains the entire Go runtime a first assumption is that these were included as part of the Go Runtime.
What is the Go runtime
The Go Runtime is the core of a Go program. It contains Go’s systems like garbage collection, concurrency, etc.
Go links its runtime and all other depedencies statically into each Go executable. This allows Go executables to be self-contained, meaning they don’t need any extra libraries to run. It just uses the given OS’s functions. This also means that each Go executable contains the Go runtime pretty much in its entirety.
TIP
We can actually inspect our executable using ldd to check if it links anything dynamically
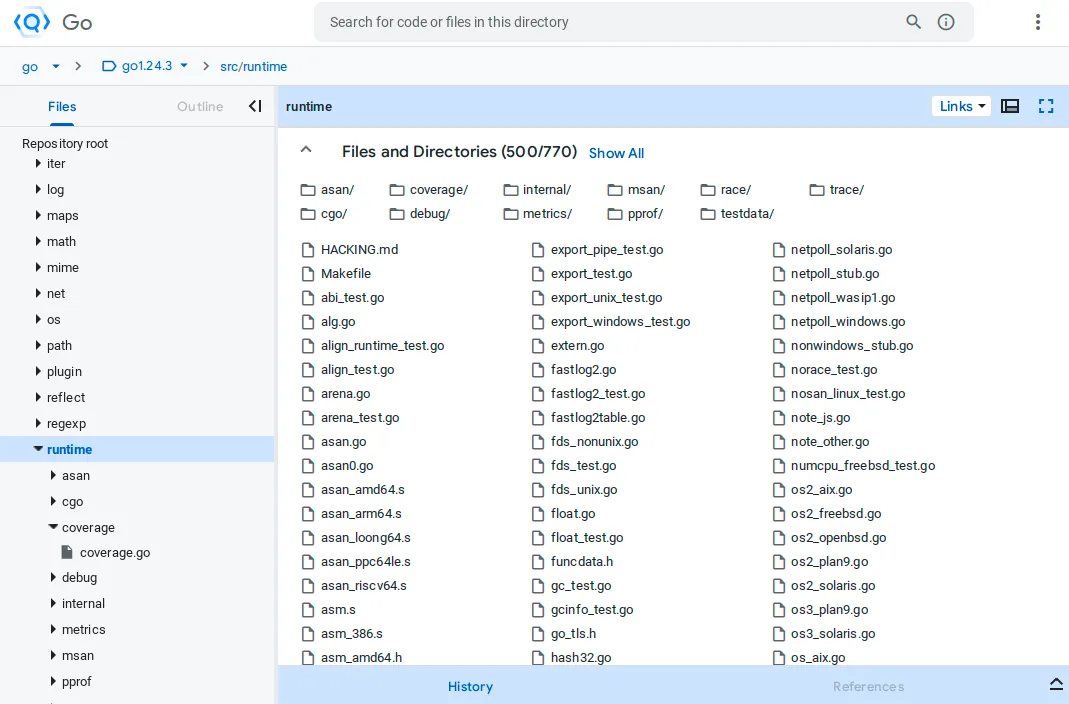
Now let us have a look at what is inside the Go runtime. Since Go is open source we can simply have a look into Google’s Go Repository. The runtime is inside the src/runtime subdirectory:
Lets now clone the repository and have search for some of our crypto primitives:
The name “darwin” suggests this is part of the runtimes Darwin/macOS specific code. If we have a look at the Mac OS 15.6 Manual Page entry for arc4random_buf2 it tells us that the arc4random and related functions are the preferred way of generating random numbers. Meaning RC4, or rather a function that once used RC4, is being used as a pseudo-random number generator in the runtime.
NOTE
If you have paid close attention to the Man Page you might have noticed that arc4random_buf is part of the stdlib. But Go doesn’t link libc during the build process, so how can Go still acess that? Go resolves these symbols at runtime and makes direct calls so that it can make use of libc. This might sometimes be necessary, especially for Darwin/macOS which doesn’t provide a stable syscall ABI and therefore advises the use of libc.
TEXT runtime·arc4random_buf_trampoline(SB),NOSPLIT,$0
504
MOVL 8(DI), SI // arg 2 nbytes
505
MOVQ 0(DI), DI // arg 1 buf
506
CALL libc_arc4random_buf(SB)
507
RET
ChaCha
ChaCha appears as part of the runtime in the rand.go file:
153
// rand returns a random uint64 from the per-m chacha8 state.
154
// This is called from compiler-generated code.
155
//
156
// Do not change signature: used via linkname from other packages.
157
//
158
//go:nosplit
159
//go:linkname rand
160
funcrand() uint64 {
161
// Note: We avoid acquirem here so that in the fast path
162
// there is just a getg, an inlined c.Next, and a return.
163
// The performance difference on a 16-core AMD is
164
// 3.7ns/call this way versus 4.3ns/call with acquirem (+16%).
165
mp :=getg().m
166
c :=&mp.chacha8
167
for {
168
// Note: c.Next is marked nosplit,
169
// so we don't need to use mp.locks
170
// on the fast path, which is that the
171
// first attempt succeeds.
172
x, ok := c.Next()
173
if ok {
174
return x
175
}
176
mp.locks++// hold m even though c.Refill may do stack split checks
177
c.Refill()
178
mp.locks--
179
}
180
}
In this case the ChaCha algorithm is used as an internal rng for each of our machine threads (“per-m chacha8 state”).
AES via x86 extensions
AES via x86 extensions appears as part of the runtime in the asm_amd64.s file:
1229
// AX: data
1230
// BX: hash seed
1231
// CX: length
1232
// At return: AX = return value
1233
TEXT aeshashbody<>(SB),NOSPLIT,$0-0
1234
// Fill an SSE register with our seeds.
1235
MOVQ BX, X0 // 64 bits of per-table hash seed
1236
PINSRW $4, CX, X0 // 16 bits of length
1237
PSHUFHW $0, X0, X0 // repeat length 4 times total
1238
MOVO X0, X1 // save unscrambled seed
1239
PXOR runtime·aeskeysched(SB), X0 // xor in per-process seed
1240
AESENC X0, X0 // scramble seed
1241
1242
CMPQ CX, $16
1243
JB aes0to15
1244
JE aes16
1245
CMPQ CX, $32
1246
JBE aes17to32
1247
CMPQ CX, $64
1248
JBE aes33to64
1249
CMPQ CX, $128
1250
JBE aes65to128
1251
JMP aes129plus
In this case the AESENC instruction is used in the aeshashbody function to scramble a hash seed.
What our executable contains
Now that we know that the Go runtime contains all these crypto-primitives for legitimate reasons we will have a look at what our executable contains.
The Go runtime
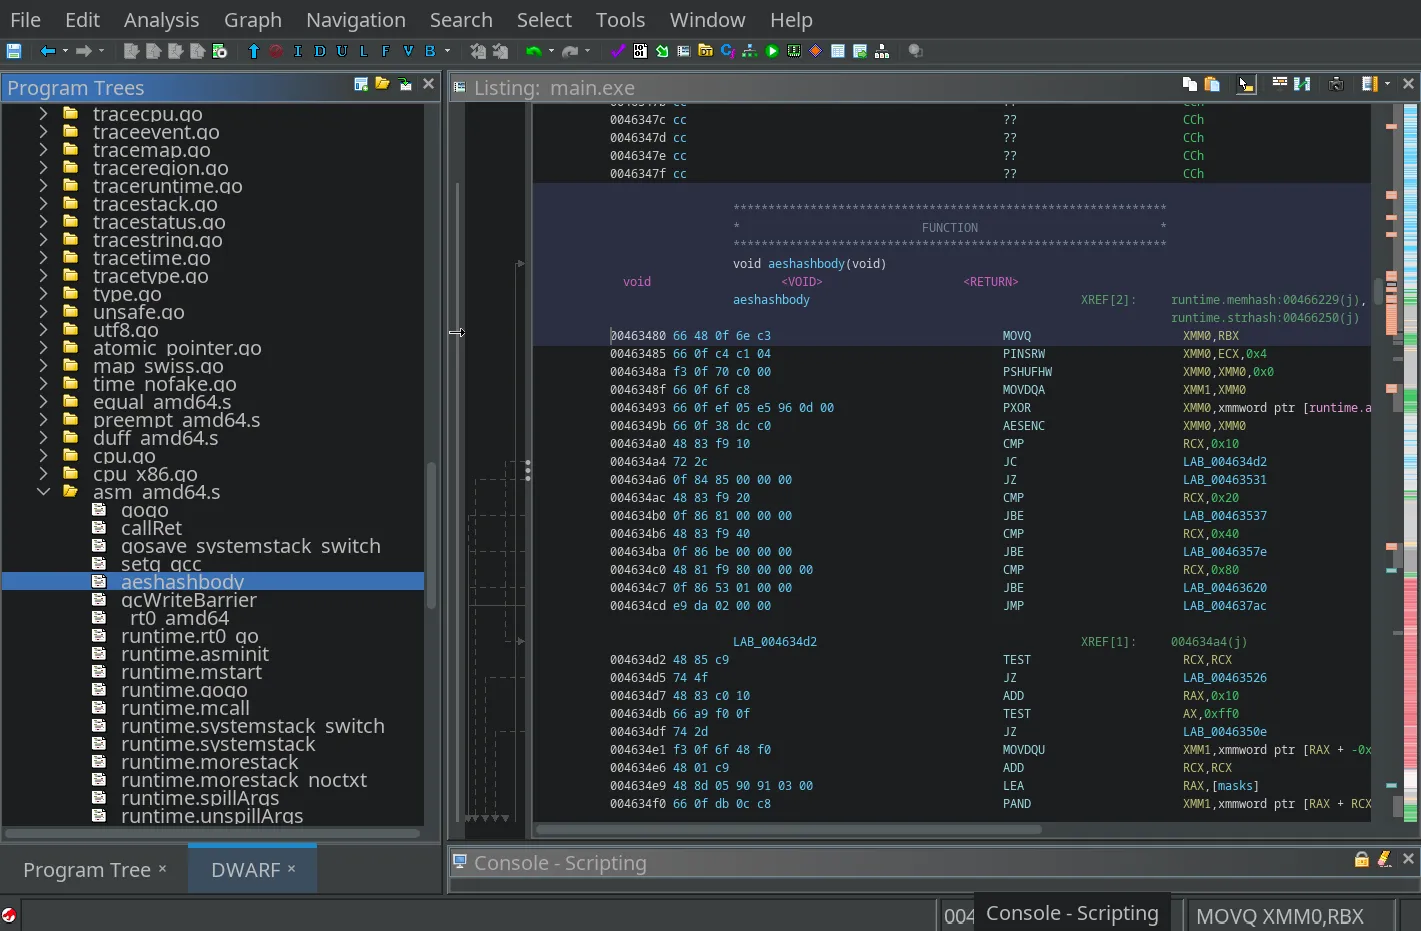
First of all let us confirm that our executable does actually contain the go runtime. This is fairly easy because of the debug symbols. We again open our executable in Ghidra und choose the DWARF Tab in the Program Trees view on the left side. We then see our files and their functions in the Program Tree. By clicking on any function Ghidra will jump to the corresponding address.
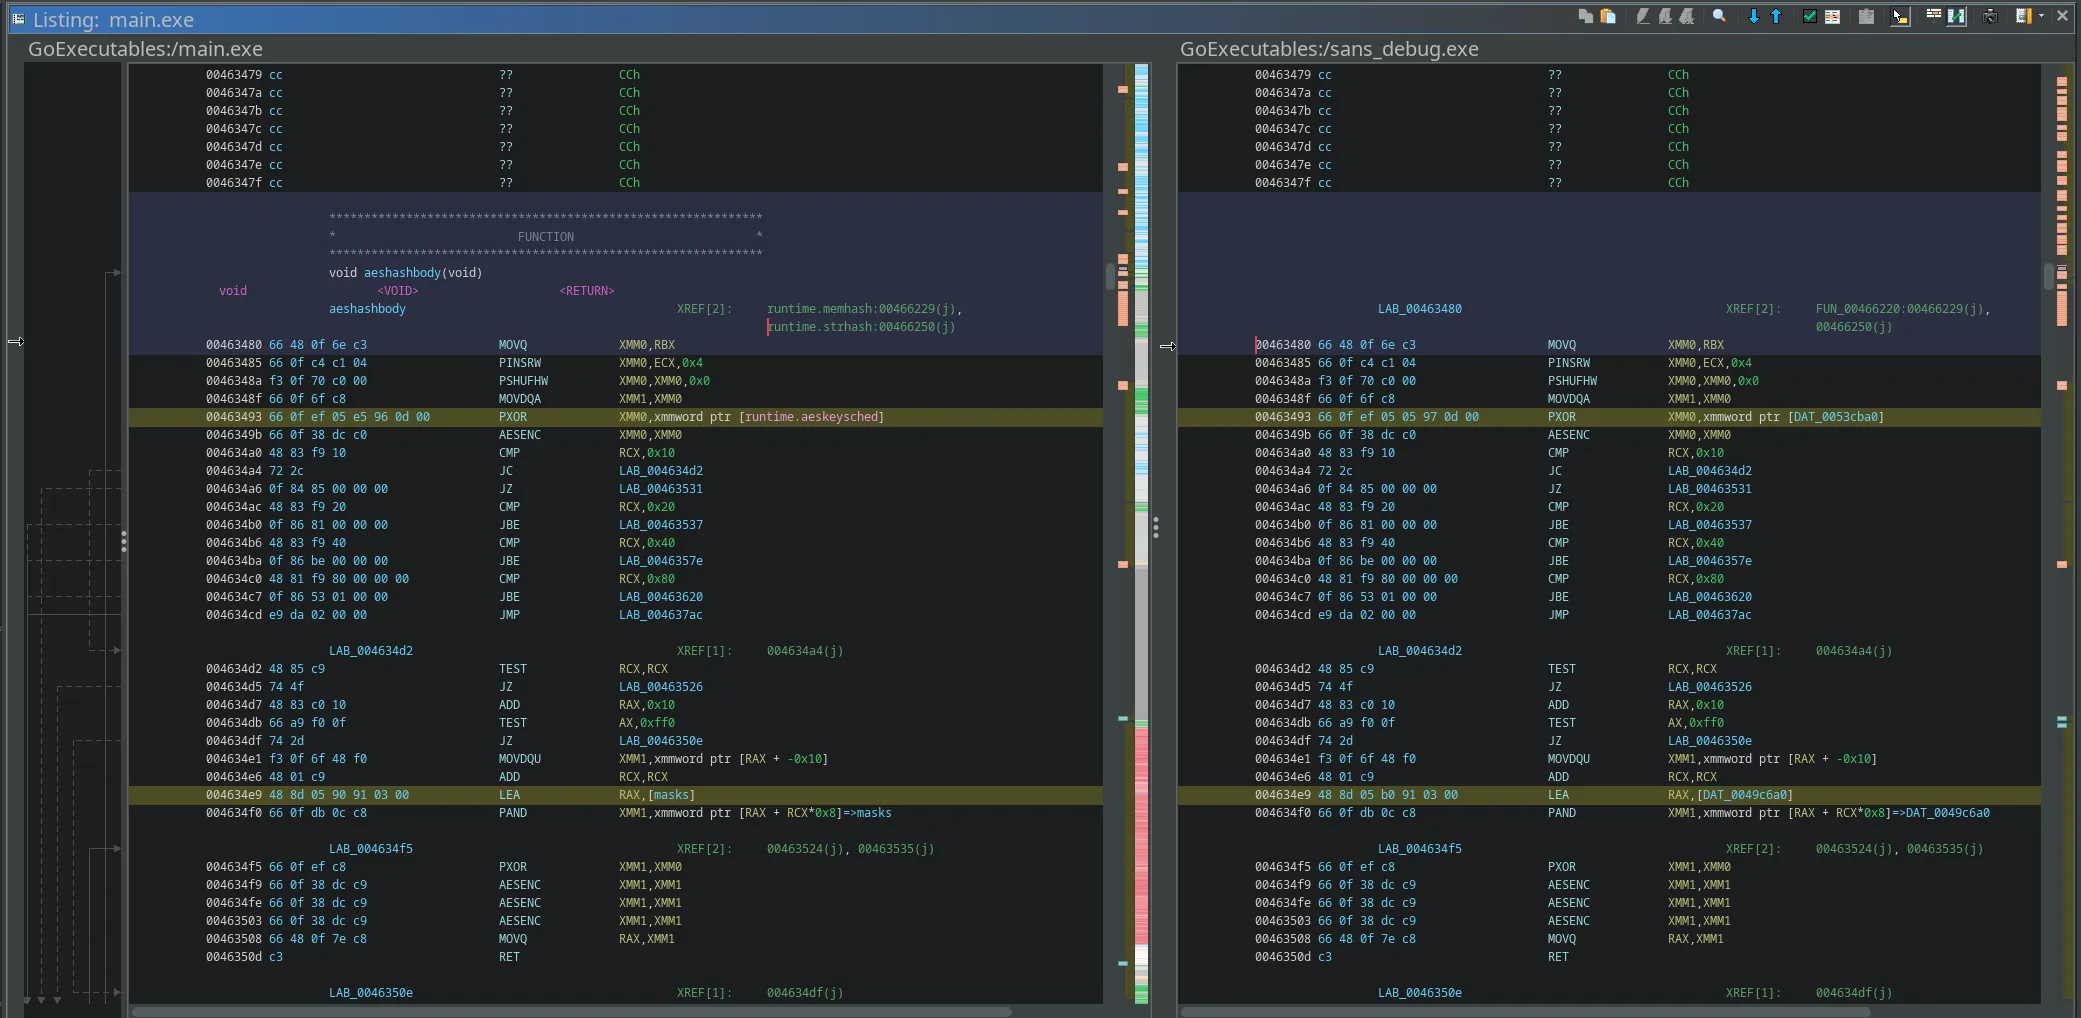
This screenshot shows the aeshashbody function from the asm_amd64.s file:
Okay, but were viewing actual actual instructions, not just debug information, right? Yes. The address of the aeshashbody function which Ghidra jumped to is 0x00463480. Looking at the Memory Map again we can see that this is inside the TEXT section meaning executable instructions. The debug symbols just add proper names and information to these instructions.
If we want we can even view our executable without debug symbols side by side. We just have to open the Diff View, choose our sans_debug.exe and select “only Bytes” as diff-target. Then we can jump back to our address using G.
And we see that our executables match. It’s just that we’re missing debug info in the sans_debug.exe.
VirusTotal Flags
We now know that the Go runtime exists in our executable. Next we want to know what VirusTotal is actually flagging. Maybe there are crypto-primitives aside from the runtime in our executable?
Sadly VirusTotal doesn’t tell us where exactly the “sandboxes” have found the flagged algorithms. What VirusTotal does tell us though is which sandboxes have found the algorithms.
The capa logo under defense evasion
The CAPE Sandbox logo under defense evasion
Again, sadly the CAPE Sandbox Report on VirusTotal doesn’t tell us where these algorithms were detected. It doesn’t even include defense evasion in the first place. The capa report also isn’t included in VirusTotal.
Luckily we can run capa and CAPE ourselves. Both capa and CAPE are open source and available on GitHub. Since capa is using static analysis3 and is easy to set up (no virtualization required) we will see if it provides us with more information first. So we download the capa binary from GitHub and start analysing:
It took capa 40 seconds to match our executable against 1354 of its integrated rules. A quick look into the “Capability” table confirms that capa found our algorithms. To now get more details about where capa found them we simply run capa again, this time with the very verbose flag (-vv).
If you care about the full output of the command you can open this detail section (it’s a lot). If not you can continue reading. In the next sections we will go over each found capability and the relevant output of the command.
- "pacer: assist ratio=workbuf is not emptybad use of bucket.mpbad use of bucket.bppreempt off reason: forcegc: phase errorgopark: bad g statusgo of nil func valuesemaRoot
rotateRightreflect.makeFuncStubtrace: out of memorywirep: already in gonegative shift amountdataindependenttimingsystem goroutine waitruntime: work.nwait= previous
allocCount=, levelBits = runtime: searchIdx = panic on system stackasync stack too largestartm: m is spinningstartlockedm: m has pfindrunnable: wrong ppreempt at unknown
pcreleasep: invalid argcheckdead: runnable gruntime: newstack at runtime: newstack sp=runtime: confused by pcHeader.textStart= timer data corruptionconcurrent map
writesinteger divide by zeroCountPagesInUse (test)ReadMetricsSlow (test)trace reader (blocked)trace goroutine statusGC weak to strong waitsend on closed channelcall not
at safe pointgetenv before env initinterface conversion: freeIndex is not valids.freeindex > s.nelemsbad sweepgen in refillspan has no free spaceruntime: work.nwait =
runtime:scanstack: gp=scanstack - bad statusheadTailIndex overflowruntime.main not on m0set_crosscall2 missingbad g->status in readywirep: invalid p stateassembly checks
failedstack not a power of 2minpc or maxpc invalidcompileCallback: type non-Go function at pc=exit hook invoked exitindex out of range [%x]ReadMemStatsSlow
(test)runtimecontentionstackschan receive (nil chan)garbage collection scanchan receive (synctest)makechan: bad alignmentclose of closed channelunlock of unlocked lock)
att&ck Defense Evasion::Obfuscated Files or Information [T1027]
mbc Defense Evasion::Obfuscated Files or Information::Encoding-Standard Algorithm [E1027.m02], Data::Encode Data::Base64 [C0026.001]
function @ 0x443540
or:
and:
mnemonic: shl @ 0x4435E8, 0x44363B
mnemonic: shr @ 0x4435C5, 0x443618, 0x44368C
number: 0x3F = modulo 64 @ 0x4436A1
or:
number: 0x3D = '=' @ 0x44368C
match: contain loop @ 0x443540
or:
characteristic: loop @ 0x443540
characteristic: tight loop @ 0x443552
...
It tells us what namespace this rule is part of, the author and scope of this rule, the Mitre ATT&CK and Malware Behavior Catalog category and finally the function and address (0x443540) where it was matched.. Below the function and address (function @ 0x443540) it tells us what parts of our rule were matched and where. Here is what each of these parts mean:
or atleast one of the children must match
and: all of the children must match
mnemonic: matches if the specified instruction mnemonic is found
number: matches if the specified number is found
match: matches another rule, herecontain loop
characteristic: matches special characteristics like:
loop: the function contains a loop
tight loop: the function contains a tight loop ( where a basic block branches to itself
So our “encode data using Base64” rule is looking for the following:
Part
Reason
left shifting
might be used to chunk bytes into 24 bit chunks, the smallest multiple of 8-bit (one byte) and 6-bit (2^6 = 64)
right shifting
used to extract 6-bit groups during encoding
the number0x3F
explained here asmodulo 64 because 0x3F is 63 and used for bitwise masking
the number0x3D
explained here as'=' because its ASCII value is that of an equal sign; It’s used to pad base64 strings
and a loop
needed to iterate over all our input data
Do we need to know all of this? Maybe not. Maybe base64 encoding is just part of the runtime and this is fine. But it’s good to know how static analysis tools like capa work. They have broadly defined rules to prevent false negatives which in turn might cause false positives.
So let us have a look at what capa is matching. Because of our debug symbols we can use addr2line to find out which source-file this function belongs to:
Terminal window
$ addr2line -e main.exe 0x00443540
/usr/lib/go/src/runtime/proc.go:6640
addr2line tells us that the address 0x00443540 is in the go runtime in the file proc.go in line 6640.
6629
// pidleput puts p on the _Pidle list. now must be a relatively recent call
6630
// to nanotime or zero. Returns now or the current time if now was zero.
6631
//
6632
// This releases ownership of p. Once sched.lock is released it is no longer
6633
// safe to use p.
6634
//
6635
// sched.lock must be held.
6636
//
6637
// May run during STW, so write barriers are not allowed.
6638
//
6639
//go:nowritebarrierrec
6640
funcpidleput(pp*p, nowint64) int64 {
6641
assertLockHeld(&sched.lock)
6642
6643
if!runqempty(pp) {
6644
throw("pidleput: P has non-empty run queue")
6645
}
6646
if now ==0 {
6647
now =nanotime()
6648
}
6649
if pp.timers.len.Load() ==0 {
6650
timerpMask.clear(pp.id)
6651
}
6652
idlepMask.set(pp.id)
6653
pp.link = sched.pidle
6654
sched.pidle.set(pp)
6655
sched.npidle.Add(1)
6656
if!pp.limiterEvent.start(limiterEventIdle, now) {
6657
throw("must be able to track idle limiter event")
6658
}
6659
return now
6660
}
That does not look like a base64 encoder. So what is in our function that capa matches? To understand that we’ll need to look at the machine code pidleput produces. We’ll dump the pidleput function using Go’s objdump tool.
If you are interested in the full dump you can have a look at it here (it’s very long again). We will have a look at the relevant parts in the following sections.
Full objdump output
Terminal window
go tool objdump -s '^runtime\.pidleput$' main.exe
TEXT runtime.pidleput(SB) /usr/lib/go/src/runtime/proc.go
The first part matched by capa is the left shift mnemonic: mnemonic: shl @ 0x4435E8, 0x44363B. Thanks to the debug info the object-dump shows us which line of code these adresses belong to.
proc.go:6625 0x4435e8 d3e7 SHLL CL, DI
...
proc.go:6618 0x44363b d3e7 SHLL CL, DI
The first left shift instruction occurs in line 6625, inside the clear function:
6622
// clear clears P id's bit.
6623
func (p pMask) clear(idint32) {
6624
word := id /32
6625
mask :=uint32(1) << (id %32)
6626
atomic.And(&p[word], ^mask)
6627
}
Like the description of clear says the function clears the last p bits of the id int. To do that a left-shift is used to prepare a bit-mask. So the left-shift is being use legitimately.
The second left shift instruction occurs in line 6618, inside the set function:
6615
// set sets P id's bit.
6616
func (p pMask) set(idint32) {
6617
word := id /32
6618
mask :=uint32(1) << (id %32)
6619
atomic.Or(&p[word], mask)
6620
}
Similarly to the clear function the set function uses the left-shift to prepare a bit-mask. The left-shift here is also legitimate.
These functions were called in the lines 6650 and 6652 of pidleput respectively. They were inlined by the compiler because they’re so small, which is why they are now part of pidleputs instructions.
6640
funcpidleput(pp*p, nowint64) int64 {
6641
assertLockHeld(&sched.lock)
6642
6643
if!runqempty(pp) {
6644
throw("pidleput: P has non-empty run queue")
6645
}
6646
if now ==0 {
6647
now =nanotime()
6648
}
6649
if pp.timers.len.Load() ==0 {
6650
timerpMask.clear(pp.id)
6651
}
6652
idlepMask.set(pp.id)
6653
pp.link = sched.pidle
6654
sched.pidle.set(pp)
6655
sched.npidle.Add(1)
6656
if!pp.limiterEvent.start(limiterEventIdle, now) {
6657
throw("must be able to track idle limiter event")
6658
}
6659
return now
6660
}
Matched right-shifts
The right shifts are a little less obvious: shr @ 0x4435C5, 0x443618, 0x44368C
We can see that objdump is reporting the same lines 6618 and 6625 for the first two right-shifts. That would be the mask creation in the set and clear function again. What we are actually looking for are the lines 6617 and 6624 responsible for dividing the id.
6615
// set sets P id's bit.
6616
func (p pMask) set(idint32) {
6617
word := id /32
6618
mask :=uint32(1) << (id %32)
6619
atomic.Or(&p[word], mask)
6620
}
6621
6622
// clear clears P id's bit.
6623
func (p pMask) clear(idint32) {
6624
word := id /32
6625
mask :=uint32(1) << (id %32)
6626
atomic.And(&p[word], ^mask)
6627
}
When dividing integers the compiler is using a clever trick to account for negative values when rounding. Two additional right-shifts are used for this. If you care about the why and how, you can read the detail section.
Rounding towards 0 during integer division with negative values
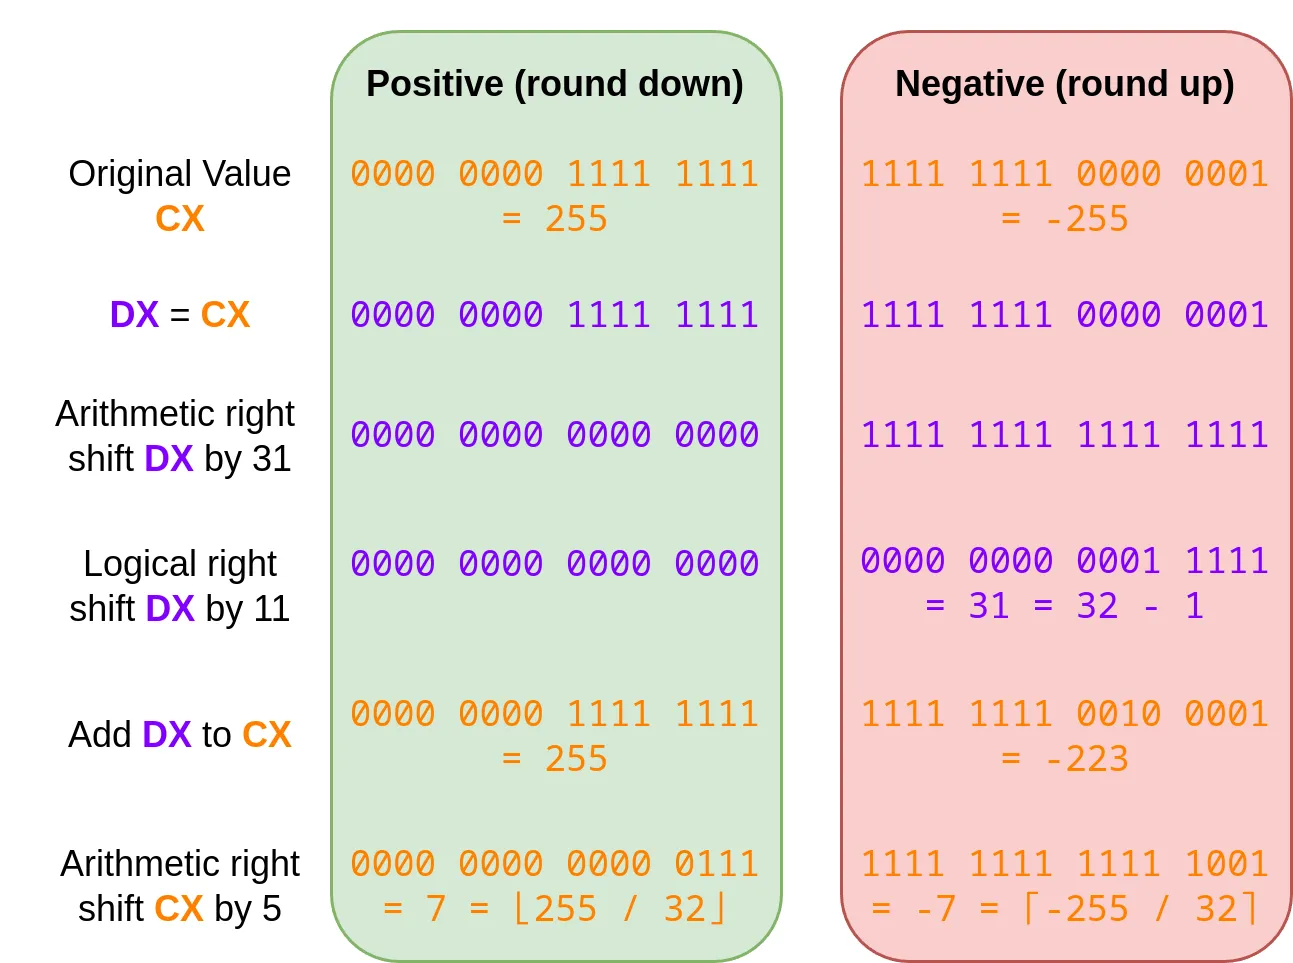
What we want to happen during integer division is that computer rounds towards 0. Meaning for positive numbers we round down (⌊25⌋=⌊2.5⌋=2.0) and for negative numbers we round up (⌈2−5⌉=⌈−2.5⌉=−2.0). We want this because removing the fractional part of a number is intuitive for humans when doing integer division.
For positive numbers we don’t need to do anything because shifting the bits already rounds down (this assumes division by a multiple of 2). For negative numbers however rounding down would mean rounding away from 0 (⌊2−5⌋=⌊−2.5⌋=−3.0)
So what the compiler does before the division of a negative value is adding divisor - 1 to the value. This means that if we divide a negative value x by 32 we add 31 to x before dividing. If instead we want to divide by 16 we add 15 to our value x.
This way whenever the division of our value x would result in a fraction instead of an integer the fractional sum crosses 1 and the integer part increments.
On the machine side this is done through right-shifting:
We do an arithmetic right-shift by the full integer width. Leaving us with a mask that is either 0xF...F for negative or 0x0...0 for positive integers.
We then right-shift that mask by ‘integer width−log2(n)‘ where n is what we want to divide by. This way we have a value of n−1 as mask for negative values. Meaning for division by 32 right-shift by 32−log2(32)=32−5=27 resulting in a value of 31. For positive values this mask stays 0.
Then we add this mask to the original number and finally divide by 32 (right shift by 5)
I illustrated this whole process for 16-bit integers:
Illustration of integer division correction
So the first two right-shifts are legitimate. The third right-shift also happens in inlined functions:
pidleput calls the start function of a limiterEvent in mgclimit.go
6640
funcpidleput(pp*p, nowint64) int64 {
6641
assertLockHeld(&sched.lock)
6642
6643
if!runqempty(pp) {
6644
throw("pidleput: P has non-empty run queue")
6645
}
6646
if now ==0 {
6647
now =nanotime()
6648
}
6649
if pp.timers.len.Load() ==0 {
6650
timerpMask.clear(pp.id)
6651
}
6652
idlepMask.set(pp.id)
6653
pp.link = sched.pidle
6654
sched.pidle.set(pp)
6655
sched.npidle.Add(1)
6656
if!pp.limiterEvent.start(limiterEventIdle, now) {
6657
throw("must be able to track idle limiter event")
6658
}
6659
return now
6660
}
the start function in turn calls the typ function of a limiterEventStamp
409
func (e *limiterEvent) start(typlimiterEventType, nowint64) bool {
So far nothing suspicious, maybe the magic numbers are though?
The first number 0x3F which is usually used in modulo 64 calculations is at address 0x4436A1 which is another inlined function. The call chain is as follows again:
We begin by calling start of the limiterEvent.
6640
funcpidleput(pp*p, nowint64) int64 {
6641
assertLockHeld(&sched.lock)
6642
6643
if!runqempty(pp) {
6644
throw("pidleput: P has non-empty run queue")
6645
}
6646
if now ==0 {
6647
now =nanotime()
6648
}
6649
if pp.timers.len.Load() ==0 {
6650
timerpMask.clear(pp.id)
6651
}
6652
idlepMask.set(pp.id)
6653
pp.link = sched.pidle
6654
sched.pidle.set(pp)
6655
sched.npidle.Add(1)
6656
if!pp.limiterEvent.start(limiterEventIdle, now) {
6657
throw("must be able to track idle limiter event")
6658
}
6659
return now
6660
}
Notice that we passed limiterEventIdle, a constant with a value of 3 to start:
limiterEvents
350
const (
351
limiterEventNonelimiterEventType=iota// None of the following events.
352
limiterEventIdleMarkWork// Refers to an idle mark worker (see gcMarkWorkerMode).
353
limiterEventMarkAssist// Refers to mark assist (see gcAssistAlloc).
354
limiterEventScavengeAssist// Refers to a scavenge assist (see allocSpan).
355
limiterEventIdle// Refers to time a P spent on the idle list.
356
357
limiterEventBits=3
358
)
Next the start function calls makeLimiterEventStamp, passing the previous limiterEventIdle constant:
409
func (e *limiterEvent) start(typlimiterEventType, nowint64) bool {
There is no value of 63 here though? This magic number only becomes apparent once you replace the constant values typ and limiterEventBits and understand what the compiler is doing.
typ has the value limiterEventIdle, so 4. limiterEventBits has a value of 3.
Meaning our snippet gets evaluated by the compiler like follows:
And that is exactly what the compiler then does. Setting the bit at position 63 (0-indexed) of our 64-bit integer using the Bit Test and Set QuadWord instruction :
BTSQ $0x3f, DX
As for the number 0x3D, which might be an ASCII equal-sign (=) used for padding in base64, it’s the same story. Just replace the limiterEventBits with 3 again and you get the value 61 in the typ function
409
func (s limiterEventStamp) typ() limiterEventType {
Since capa’s v7.0 release it technically also does dynamic analysis using the CAPE sandbox. It requires CAPE to do the dynamic analysis for it and is then able to read CAPE’s report. For more details read the dedicated blog post by Mandiant. ↩
 The image section headers of our Windows executable. We can see the actual and assigned names.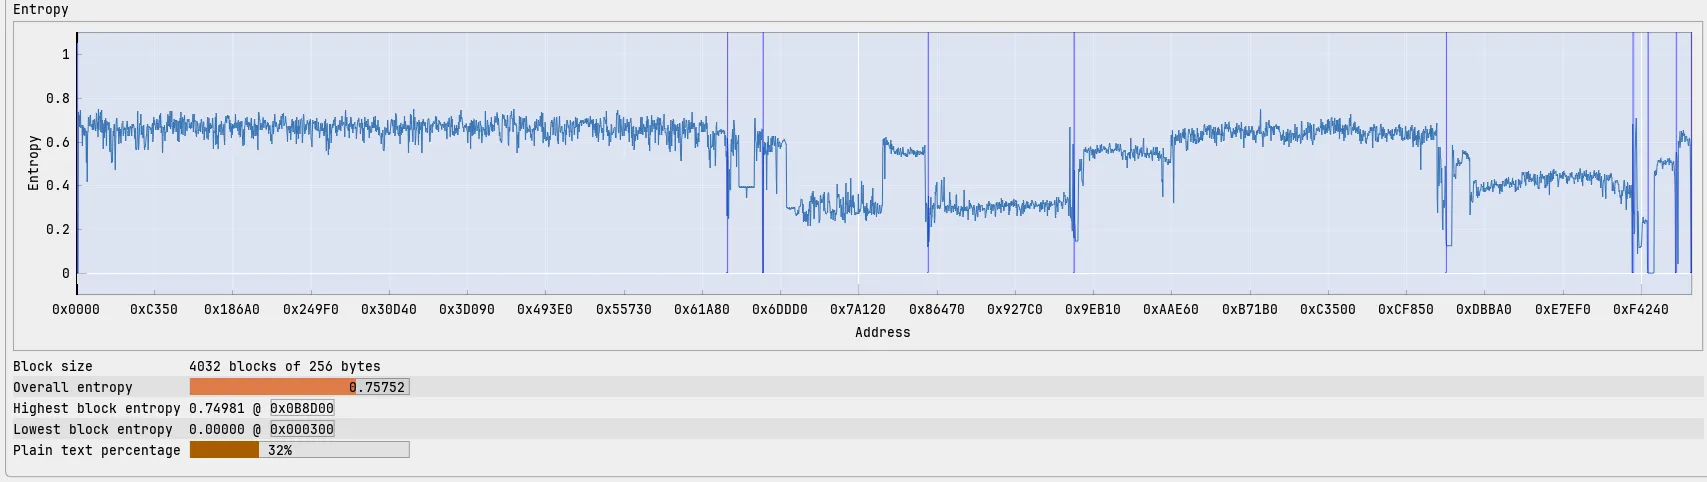
 The VirusTotal scan without debug symbols now shows just 6/71 instead of 9/71 flags.
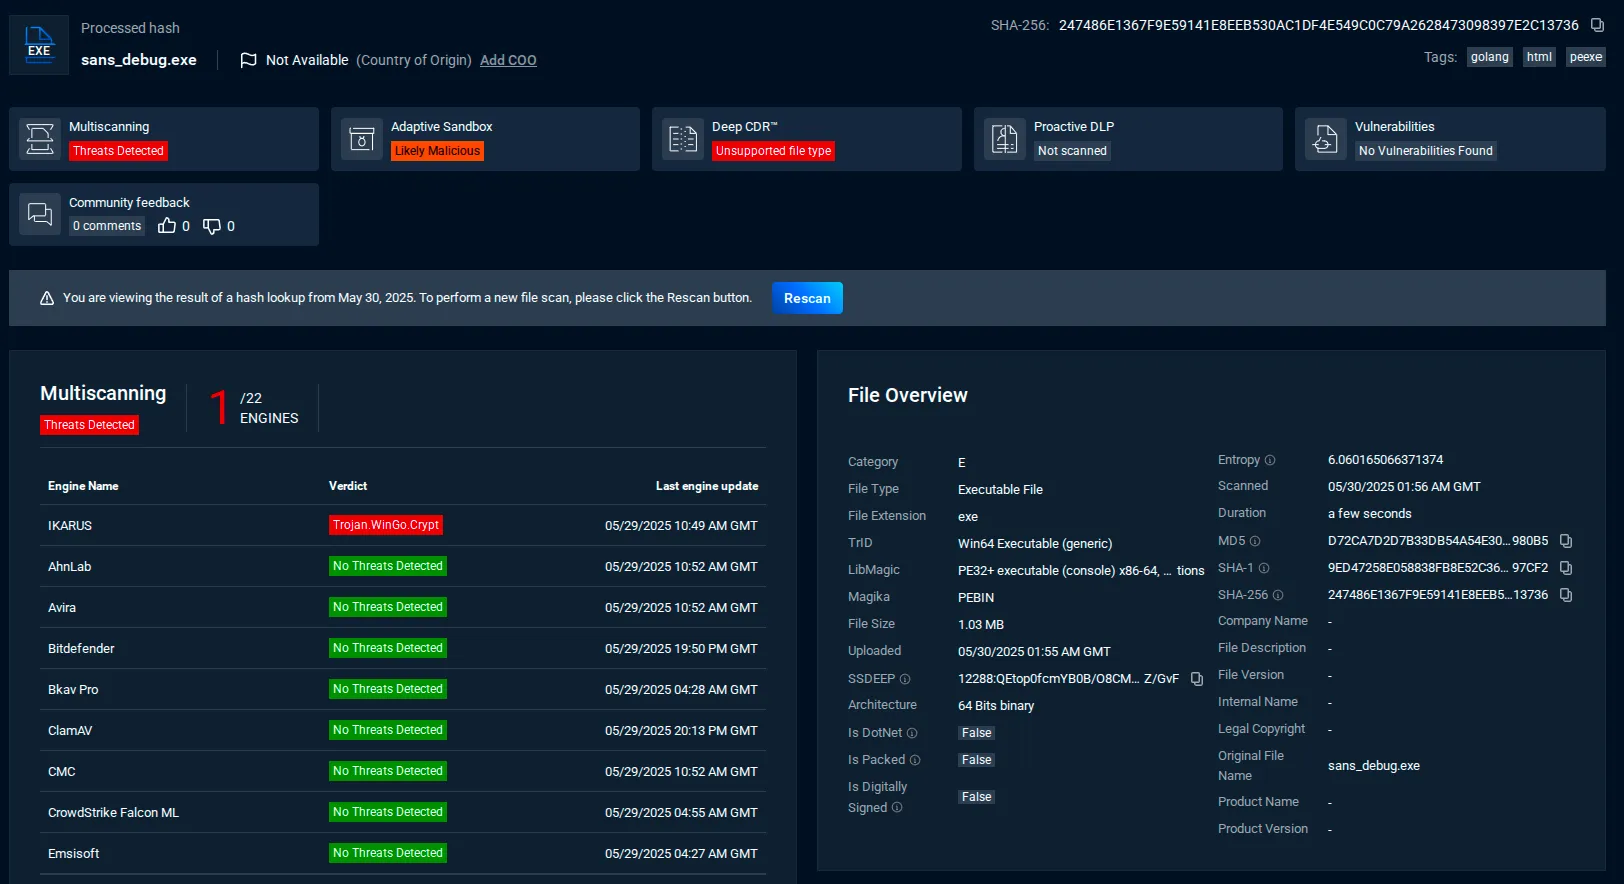 The MetaDefender Cloud scan without debug symbols now shows just 1/22 instead of 2/22 flags.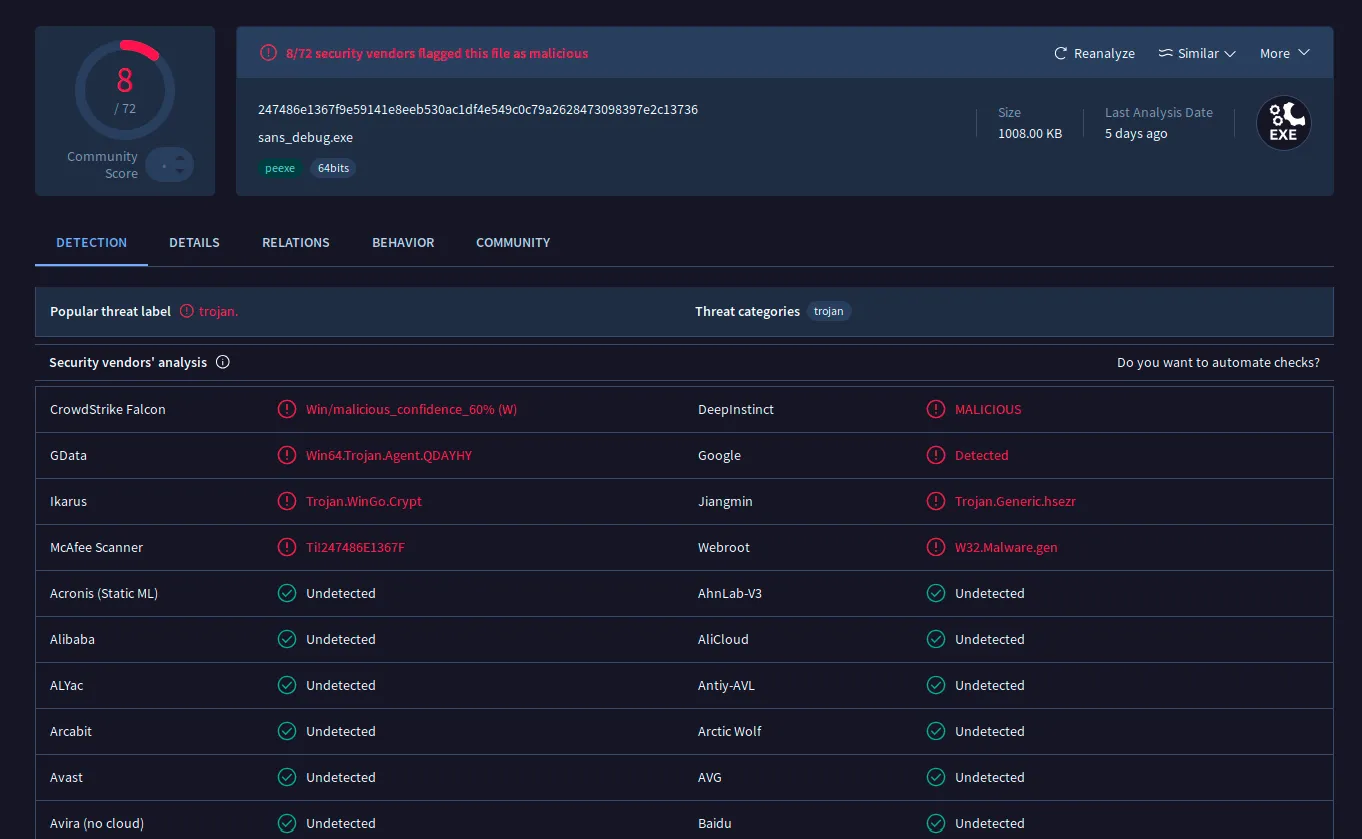
 The capa logo under defense evasion
 The CAPE Sandbox logo under defense evasion